Exporting weed locations
We talk a lot about how the STA logger is a holistic, integrated weed management solution. The way it works is that while the weed control works are being conducted, it is reporting the activities, helping supervisors and managers coordinate their teams, and is making all data available in an easy to use GIS platform. It is essentially tracking your weeds location while you work. All of this is automatic and pre-processed in an easy to interpret format.
But what if you don’t want all that? What if you just need to complete a weed mapping and control project like you normally would with a handheld GPS? Or sometimes called “map and treat”. The STA logger is still the solution for you.
Tracking weed locations and weed mapping
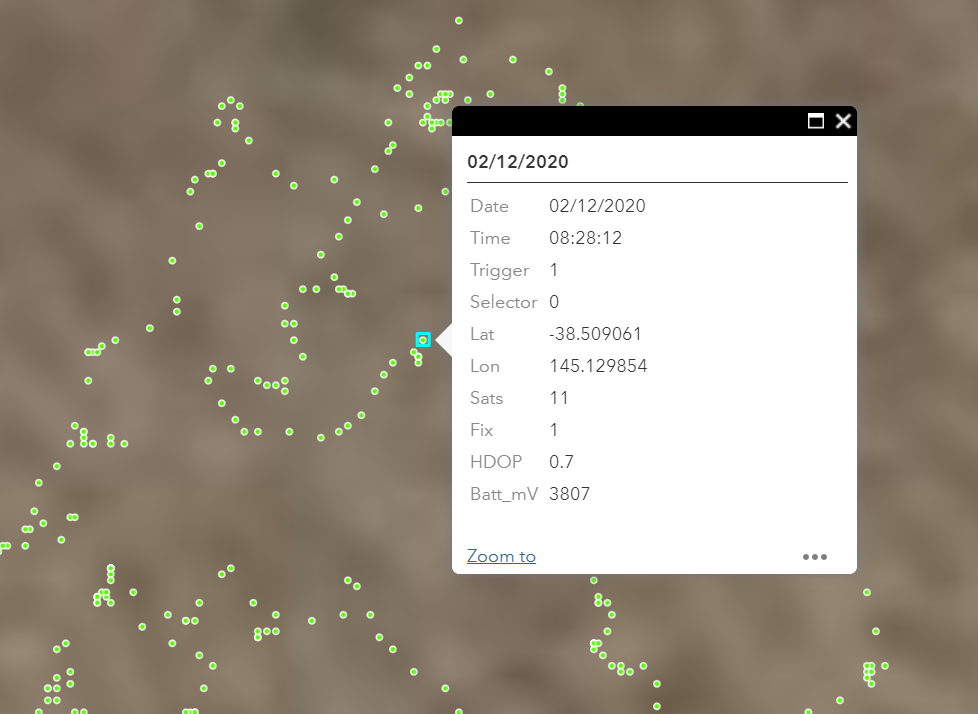
The STA logger tracks the location of the spray equipment it is attached to, and logs the location of spraying from the trigger. This is presented through 3 spatial data layers. The first is the “tracklog” which is a polyline the represents the path the unit travelled. It is useful for understanding where each member of your team travelled while trying to find weeds and is useful in identifying where gaps in effort might occur. The second is the “spray zone” which is a polygon layer representing the area of ground that was sprayed based on the duration of the trigger press. It is useful for comparing one units output to another, or the collective efforts of all units on a site. The third layer is the raw points. These are largely unprocessed data points from the unit recorded at one point per second. In each point you will have the date, time, battery level, coordinates, number of satellites, type of GPS fix, horizontal dilution of precision (HDOP), trigger status (pressed or not) and which selector switch option was chosen. This point data is equivalent to what you would get out of a handheld GPS device with the bonus that it is collected, recorded and managed automatically. If you have workflows that use point data like this, this layer will be important to you.
Exporting the data
The data is yours. We have no need for it. And while we offer an arrangement of tools in our web portal, we understand that some users may need to download the data, analyse it in a third party application or supply it to a client or project team.
If your organisation has GIS capabilities, no doubt this process would be second nature to your team and quite easy to accomplish. Though, many STA logger users lack this capacity and still have a requirement to export the point data.
Through the STA logger web portal, you can download this raw point information to .csv file. A .csv (or comma separated values) file can be opened by spreadsheet applications such as Google Sheets and Microsoft Excel. This is an easy to manage, interchangeable format because from there it can also be imported into a desktop GIS application or converted into a spatial file like a shapefile using an online converter.
The ‘how to’:
1. Zoom in to your area of interest, ensuring the map frame encompasses all the data you need.
2. Open the attribute table at the bottom.

3. Select ‘Filter by map extent’ so that the table only shows data that is within the maps frame. This may take a few seconds to complete as it analyses the data.
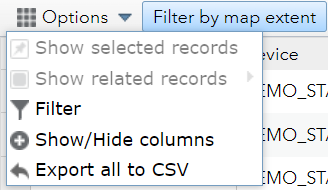
4. Open the ‘Options’ menu, select ‘Filter’ and use the tool to filter for any conditions you want met, such as dates or selector switch settings. In this example, we’ll filter to show only the data where the trigger on the spray device is being pressed. To do that, select ‘Add expression’, choose the ‘GPS_trigger’ field in the first drop down box, leave ‘is’ as the default in the middle drop down, and enter ‘1’ in the final box. Click ‘Ok’.

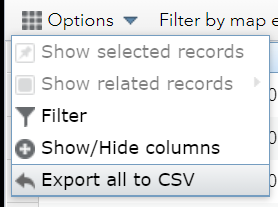
5. Again, in the ‘Options’ menu, select ‘Export all to CSV’
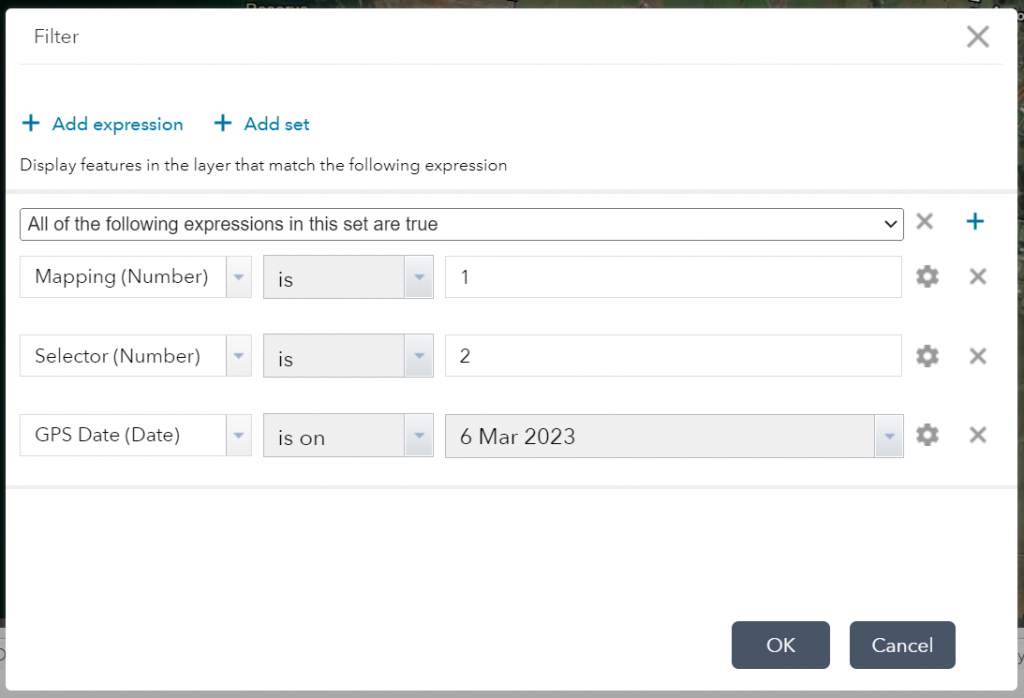
A .csv file will be downloaded. Note, that the maximum number of rows in one export is 2,000. If you need to export more than that, consider breaking up your area of interest into multiple downloads, or add more filters to really nail down what data you need. Consider using the ‘Mapping’ field for filtering. Unlike the ‘GPS_trigger’ field which returns a ‘1’ for every second the trigger was being pulled, the ‘Mapping’ field only returns a ‘1’ at the beginning of the trigger presses. For example, if an operator sprayed weeds and held the trigger for five seconds, the ‘GPS_trigger’ field would return five ‘1’ values in quick succession. However, the ‘Mapping’ field would only return a ‘1’ once, at the beginning of the trigger presses.
Consider the example below where we have added a filter set, and we are selecting for the conditions where ‘Mapping’ is ‘1’, ‘Selector’ is ‘2’ and ‘GPS_date’ is a specific date in our dataset.
Once you have the .csv file, you can then save it, analyse it, combine it with other data, import it into GIS, convert it’s format, etc.
You may also want do add your own information to the file. For example, you may want to add info about what herbicide was used in a new row, what weeds were targeted etc. Then from there, you can convert to a common spatial file type like shapefile as mentioned above.
The STA logger platform is flexible to accommodate your map and treat needs.
Recent Posts

STA logger onboarding
Read More »
So, why the STA logger?
Read More »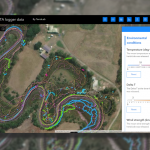
Project and herbicide reporting using the STA logger
Read More »
Why weed control contractors are flocking to use the STA logger
Read More »