
Understanding the mapping layer
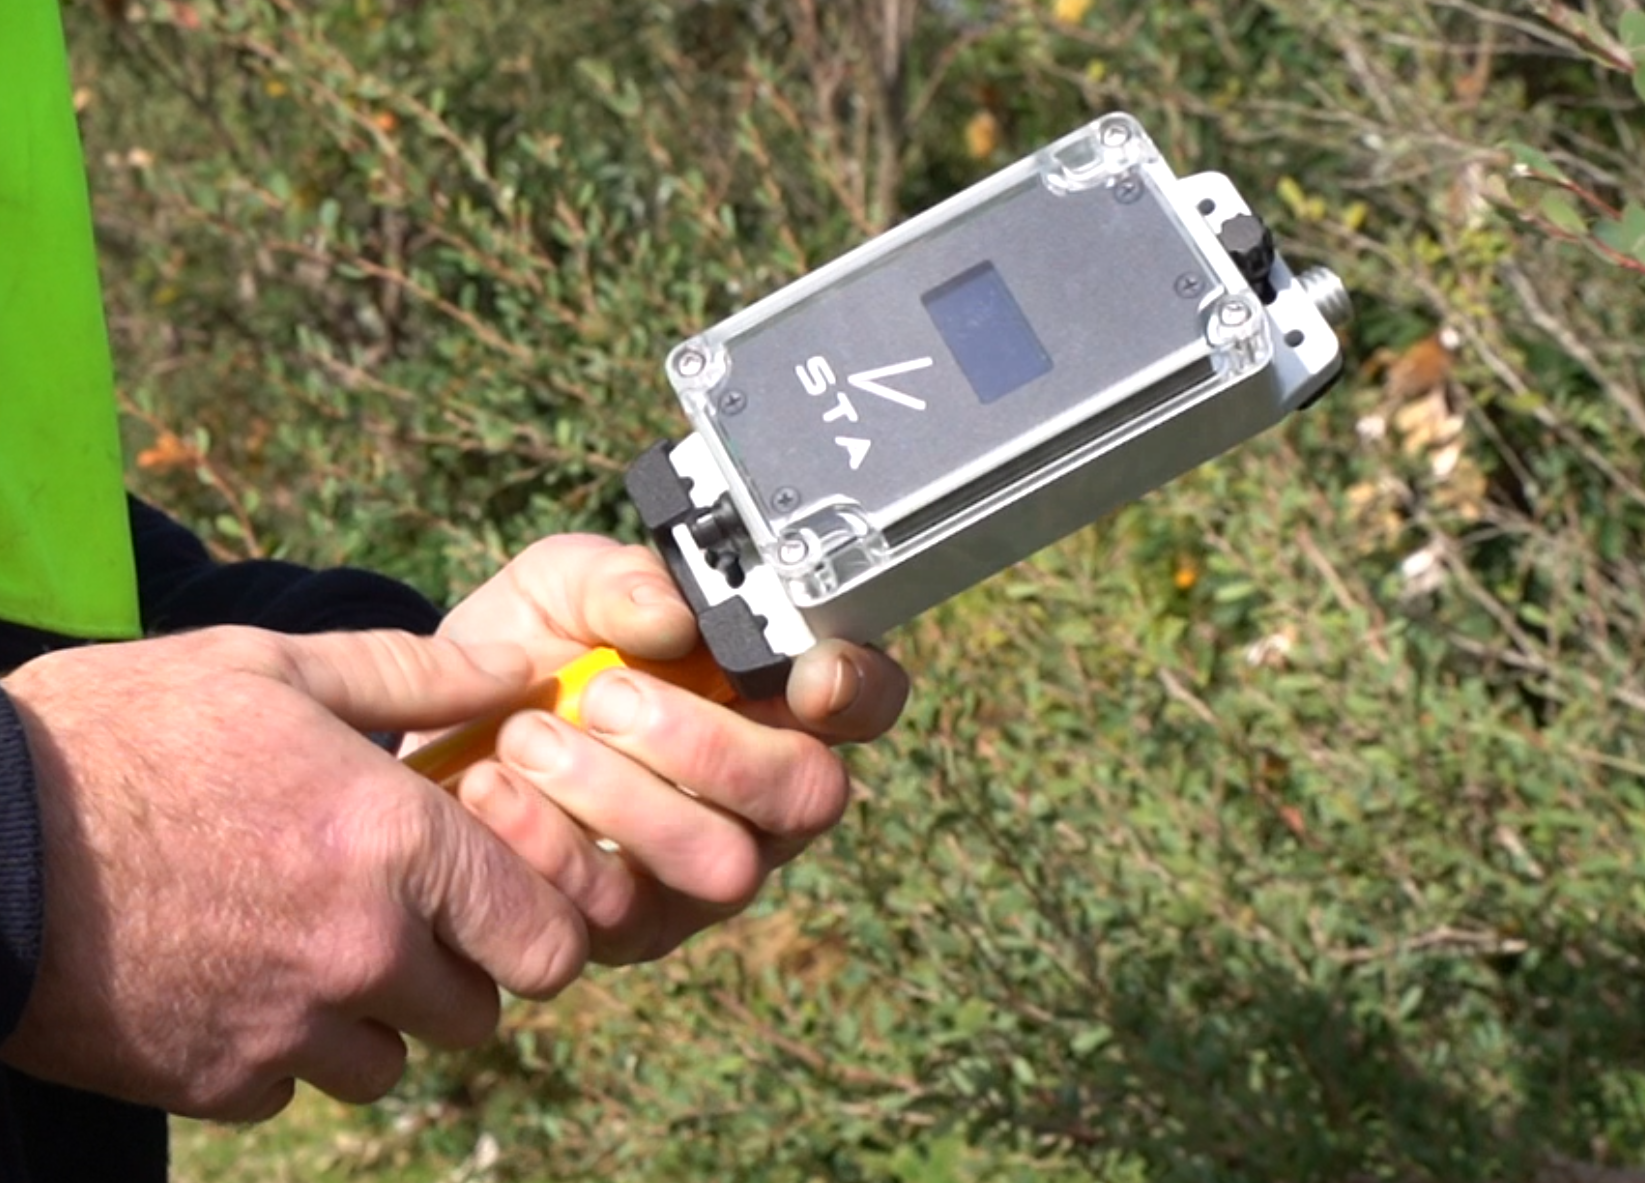
One of the most powerful, but sometimes overlooked, attributes in the STA workflow is the Mapping layer. While the standard point layer records every individual trigger event captured by the device second-by-second, the Mapping layer is designed to simplify that information into meaningful operational events.
In short, it removes duplication and creates a cleaner dataset for mapping and analysis.

What is the mapping layer?
The STA Logger and STA Explorer record data at high frequency. During weed spraying, for example, a trigger may remain active for several seconds while an operator treats a single weed infestation. If a spray event lasts five seconds, the raw points layer will contain five individual records (one for each second the trigger was active).
From an operational perspective, this is valuable. It provides a precise timeline of activity and allows detailed productivity and behaviour analysis. However, for mapping purposes, those five records often represent only a single weed occurrence. Displaying every trigger point can create unnecessary duplication and clutter on maps, particularly over large datasets. The Mapping layer solves this problem.

Mapping data appears as points.
How the Mapping Layer Works
The Mapping attribute identifies the final point in a continuous trigger sequence and marks it as the representative event. For a weed spraying sequence:
- Five seconds of continuous spraying will produce five GPS points
- Only the final point in that sequence receives a Mapping value of 1
- The earlier points in the sequence remain in the dataset, but are not flagged as mapping events
This allows users to simply filter the dataset for: Mapping = 1
The result is a concise, de-duplicated map of weed locations. Instead of seeing five points for one blackberry patch, users see a single meaningful event.

Tree Planting with the STA Explorer
The same concept also applies to tree planting workflows using the STA Explorer. Using the integrated motion sensor, the Explorer automatically detects planting actions and records them as operational events. As with spraying, the raw data can include multiple closely spaced records associated with a single planting action. The Mapping layer is used to determine which event is considered the final accepted planting event.
In this workflow:
- A Mapping value of 1 indicates the final planting event believed to represent the successful plant location
- A Mapping value of 2 indicates a repeat or failed planting attempt in close proximity to the real one.
This is particularly useful because tree planters often make several rapid motions while establishing a seedling. Some may represent repositioning, retries, or unsuccessful attempts before the final plant is completed.
Rather than forcing users to manually clean the data, the STA Explorer automatically interprets these patterns.
The distance and time thresholds that isolate repeat planting events can be adjusted in the software by contacting support. This is particularly useful if planting in high densities.
Using the Mapping Layer in Practice
For most operational mapping tasks, the recommended workflow is straightforward:
- Use the full points layer when detailed operational analysis is required
- Filter for
Mapping = 1when creating concise maps of weed locations or planted trees - Optionally review
Mapping = 2events to analyse repeat planting behaviour or failed attempts
This provides a much cleaner representation of field activity while still preserving the underlying raw operational data.
A Better Balance Between Detail and Simplicity
The Mapping layer reflects one of the core design principles behind the STA platform: capturing rich operational data without overwhelming users with unnecessary complexity. The raw data remains available for detailed analysis, auditing, and reporting, while the Mapping layer provides a simplified operational view ready for GIS workflows, dashboards, summaries, and mapping products.
Recent Posts

STA onboarding
Read More »
Weed Mapping Without the Extra Field Work: The Business Case for STA Logger
Read More »
Introducing the STA Sponsored Tier: $0 Annual Subscription
Read More »
Uploading STA Data Using a Phone Hotspot
Read More »