So, why the STA logger?

If you’ve managed to get this far, you’re probably already familiar with the STA logger home page and how the device can be used for weed management. On it, you’ll find a lot of info on why it is an important development for organisations involved in the delivery of conservation works. But for those of you with a background in GIS, you’re probably left wanting more details. And for the rest of you who just said “G-I-what?”, you’ll still find a lot of useful information in this post. Read on.
What problem does it solve?
When I was finishing my time at university, I was working part time spraying my share of weeds in support of conservation projects. Pre-planting spraying, post-planting spraying, controlling noxious weeds, etc. If you’re purely from a GIS or management background, you might not realise this, but spraying weeds and collecting data at the same time is hard. So much so, that it is either done as a separate activity (thus significantly increasing the cost of the project), or it isn’t done at all. The latter being a significant blemish on the record of many conservation projects worldwide.
Lets say you’re the leader of a team of four conservation workers tasked with patrolling a large refuge area and spraying 3 particularly threatening weeds. But these weeds spread quickly, and it will take many seasons of control to get them to target levels. So it makes sense to record the location of the major infestations so that they can be revisited each season for retreatment. Conventional wisdom would have this weed mapping done in one of two ways: 1. A targeted GPS mapping campaign is undertaken to locate the weeds ahead of control. Though this pretty much uses the entire first seasons project budget to complete. Or, 2. Some bright spark in management suggests that the backpack spray operators do the mapping at the same time as control.
Those not familiar with a backpack sprayer might not understand that most conventional forms require both hands. Your non-preferred hand is used to pump a handle to pressurise the sprayer while your preferred hand holds the applicator and presses the trigger. The scope for operating a handheld GPS unit is (to be generous) limited. Not only that, but if you are adhering to safety advice on the herbicide labels you will be wearing protective PVC gloves (among an assortment of other personal protective equipment). These gloves get mucky with herbicide which you will transfer to the GPS, put the GPS on your desk later, eat lunch at your desk, etc. etc. Not exactly best practice.
Then you’ve got to consider how you enter the data. Newer handheld GPS units are a bit more user friendly for entering data. Recent inclusions include touch screens which allows for data input akin to texting on a mobile phone. But again, this isn’t practical if you’re wearing PVC gloves. If you want to record something more meaningful than just some random dot in the middle of a forest, most handheld GPS’ require tactile button pressing and some form of coding system. Say you want to know an estimate of weed cover for each of the 3 target species that you map. You might designate weed 1 as ‘A’, weed 2 as ‘B’ and weed 3 as ‘C’. Then you might use some form of the braun-blanquet code for the cover. So for every point, as well as applying herbicide in rugged terrain, you’re also pulling out a GPS from your pocket with your PVC gloves and attempting to record “C2”. The button pressing for “C2” is likely to be something like: ‘enter’, ‘up’, ‘up’, ‘up’, ‘right’, ‘up’, ‘up’ ‘enter’, ‘enter’. And that’s to say nothing of the extent (how far the infestation spreads) or abundance of plants within the infestation.
Then after a hard day of traversing through the wilderness spraying and mapping weeds you either plonk your GPS on your desk to charge for the next day or handball it across to your supervisor. You think “I should back all the data up”, but you’re just keen to get home. Besides, there are 4 GPS units and you can’t find the brand specific cable right now. At the end of the project, providing you didn’t lose a GPS mid-project, you’ve got to download the data from all of the units.
So now you’ve got a bunch of files – probably duplicates if you were backing up your data or if you filled up the memory halfway. You’ll need to merge them without duplicates. You also need to convert your code to human legible words. So you either open up your data in spreadsheet format or import into your preferred GIS application. Assuming you get past the annoyance of converting a .kml or .gpx to spreadsheet, you get that done and start producing your maps. This is when you realise that some of your operators were recording points for every plant, and some were recording points for isolated regions of weeds so you’ve got a mismatch of information that isn’t that presentable for maps. Nevertheless, your primary aim was to be able to relocate the weeds the next season. So even though the data isn’t making the most presentable or analytics friendly map in the world, it fulfilled its goal.
The next season rolls around and presuming you were able to locate your merged and converted spreadsheet in your files, you now realise that you need to use your handheld GPS units proprietary software to upload the data. But you first need to convert it from a spreadsheet to their preferred format. And then replicate that for each device.
Once in the field, you navigate to the points and continue with your important work. Though now you have a few more buttons to press as you’ve got to move from the navigation screen to the data entry screen to record new points.
You’re not a data specialist – you are a conservation team leader. Many of those steps were painful. But you didn’t mind, because improving the natural environment is your passion and you want to do it right. And when those points came up on the screen, it was rewarding. The process could certainly be more efficient, but all in all, job done.
Enter, STA logger
Now we’ll consider the same weed management project, but with STA loggers to assist with weed mapping.
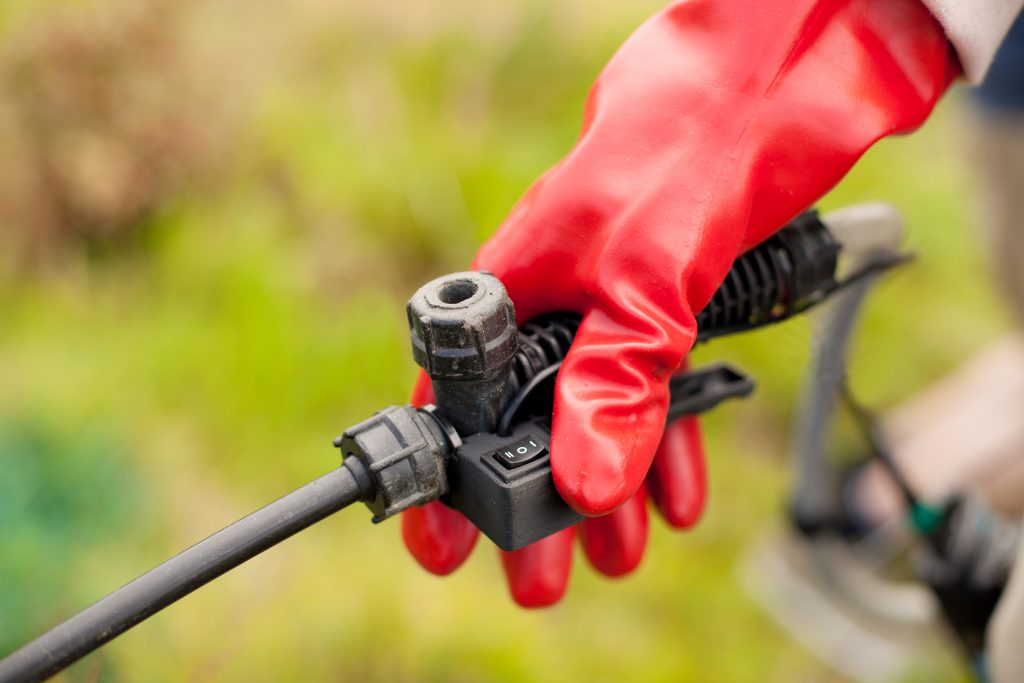
For the same price as the handheld GPS units, you bought 4 STA loggers (made by TerraLab) and equipped them to your backpack sprayers. Your team is deployed into the field and starts work as normal. The STA loggers activate as soon as the first trigger press occurs and track your location once per second. The result is a highly detailed tracklog of your activities. But when you stopped for lunch, the unit timed out to preserve battery before kicking back into gear the very next time the trigger was pressed. In the background the unit is also recording the battery level, the number of satellites it can see, the position type, the horizontal dilution of precision, and more.
In addition to the track log, every press of the trigger is recorded along with the time, duration of the press and switch category of 0, 1 or 2. That’s right, the backpack version of the STA logger has a 3-way switch on the handle for categorising your data. It is situated in the thumb position of the handle so it is ergonomically comfortable and convenient to use. If you move from one weed to another, a simple thumb movement ensures your data is recorded as a different category.
At the end of the day, you unplug the GPS component of the STA logger from the backpack (you leave the rest of it on the sprayer), and plug it in to charge. The battery lasts a few days, but that’s not why you charge it every night …
When you’re at home watching Seinfeld reruns, the STA logger is connecting to your companies WiFi network and sending your data to the cloud. There it undergoes processing and is then moved to your GIS portal. The GIS portal is your gateway to reviewing your data. You can view the data on the web using the web app, you can view it on a mobile device, or you can even ‘add’ it to your GIS project to publish professional maps for your reports. Notice I used the word ‘add’ there; not import or download. I wanted to highlight that for those with compatible GIS capabilities, you don’t need to download the data or convert formats. You add it like any other layer in your GIS. But instead of pointing at your local hard drive or network, you point it at the GIS portal. If you save your project, the layer will stay up-to-date next time you open it. No need to keep redownloading data or re-adding the layer.
The STA logger data is pre-symbolised based on the category switch. Every single spray event can be clicked on to see further details, or the daily activities can be tallied to provide area or unit summaries. Then, the next morning you can use any of those services mentioned to review the data and plan your next days work. This is to say nothing of all the other projects in your portfolio that will benefit simply be leaving the STA logger hooked up to your spray gear.
I’m hoping by now that the efficiency of this workflow is obvious. There is no data input, no data handling and no processing. It is all automatic.
What information can I get from STA logger data?
Each STA logger produces 2 layers. The first is the tracklog which was mentioned earlier. It is a polyline that shows the operators path throughout the day. When combined with the other units in your team, this data is useful for coordinating your works and project management. The second layer is a polygon layer that represents the area sprayed. This is the key information for identifying where the weeds are, how far they extend, how dense they are, etc.

Each feature in each layer has typical information you would expect from a GPS like HDOP, number of satellites and whatnot. But you will also see a calculation of the area of each spray polygon. While at the micro scale this might seem like a neat curiosity, it is the aggregate where this data becomes powerful. It can be processed and analysed in any number of ways to answer the questions that are important to your project. Consider, reporting the daily sum of the area sprayed (m2) and distance travelled of each unit. Add to that the 3-way switch data so you have 3 weeds reported each day. Then replicate that for every site that you manage so you can compare weeds in each site. Then break that into weeks, seasons or years and compare the area occupied by sprayed weeds from period to period. Then incorporate your herbicide records to estimate the application rate per infestation … I could go on.
Suddenly, instead of reporting by paragraphs of text, dots on maps, or hand drawn scribbles, you are reporting that you sprayed 853 m2 of weed 1 at Site X last year, and 290 m2 of weed 1 at Site X this year. If you really want to drive the message home, put that in a graph! Better yet, deliver the data to your client/boss/funding body through a web app where they can use time sliders to see the data change dynamically.
Not only is it an efficient reporting tool, real world decisions will be generated by the outputs. Suddenly the information that the operators in the field have is available at the click of a mouse.
The conservation industry has stepped up the game!
Weed management has never been simpler. Now we’re using real metrics. Now we’re managing the environment with data. Not only that, but the workflow for achieving it is automatic.
The STA logger is fast, efficient and powerful.
Recent Posts
STA onboarding
Read More »
Post processing STA Explorer HA data
Read More »
Accurate tree planting mapping – Using the STA explorer HA
Read More »