The STA logger web app assisting with weed management

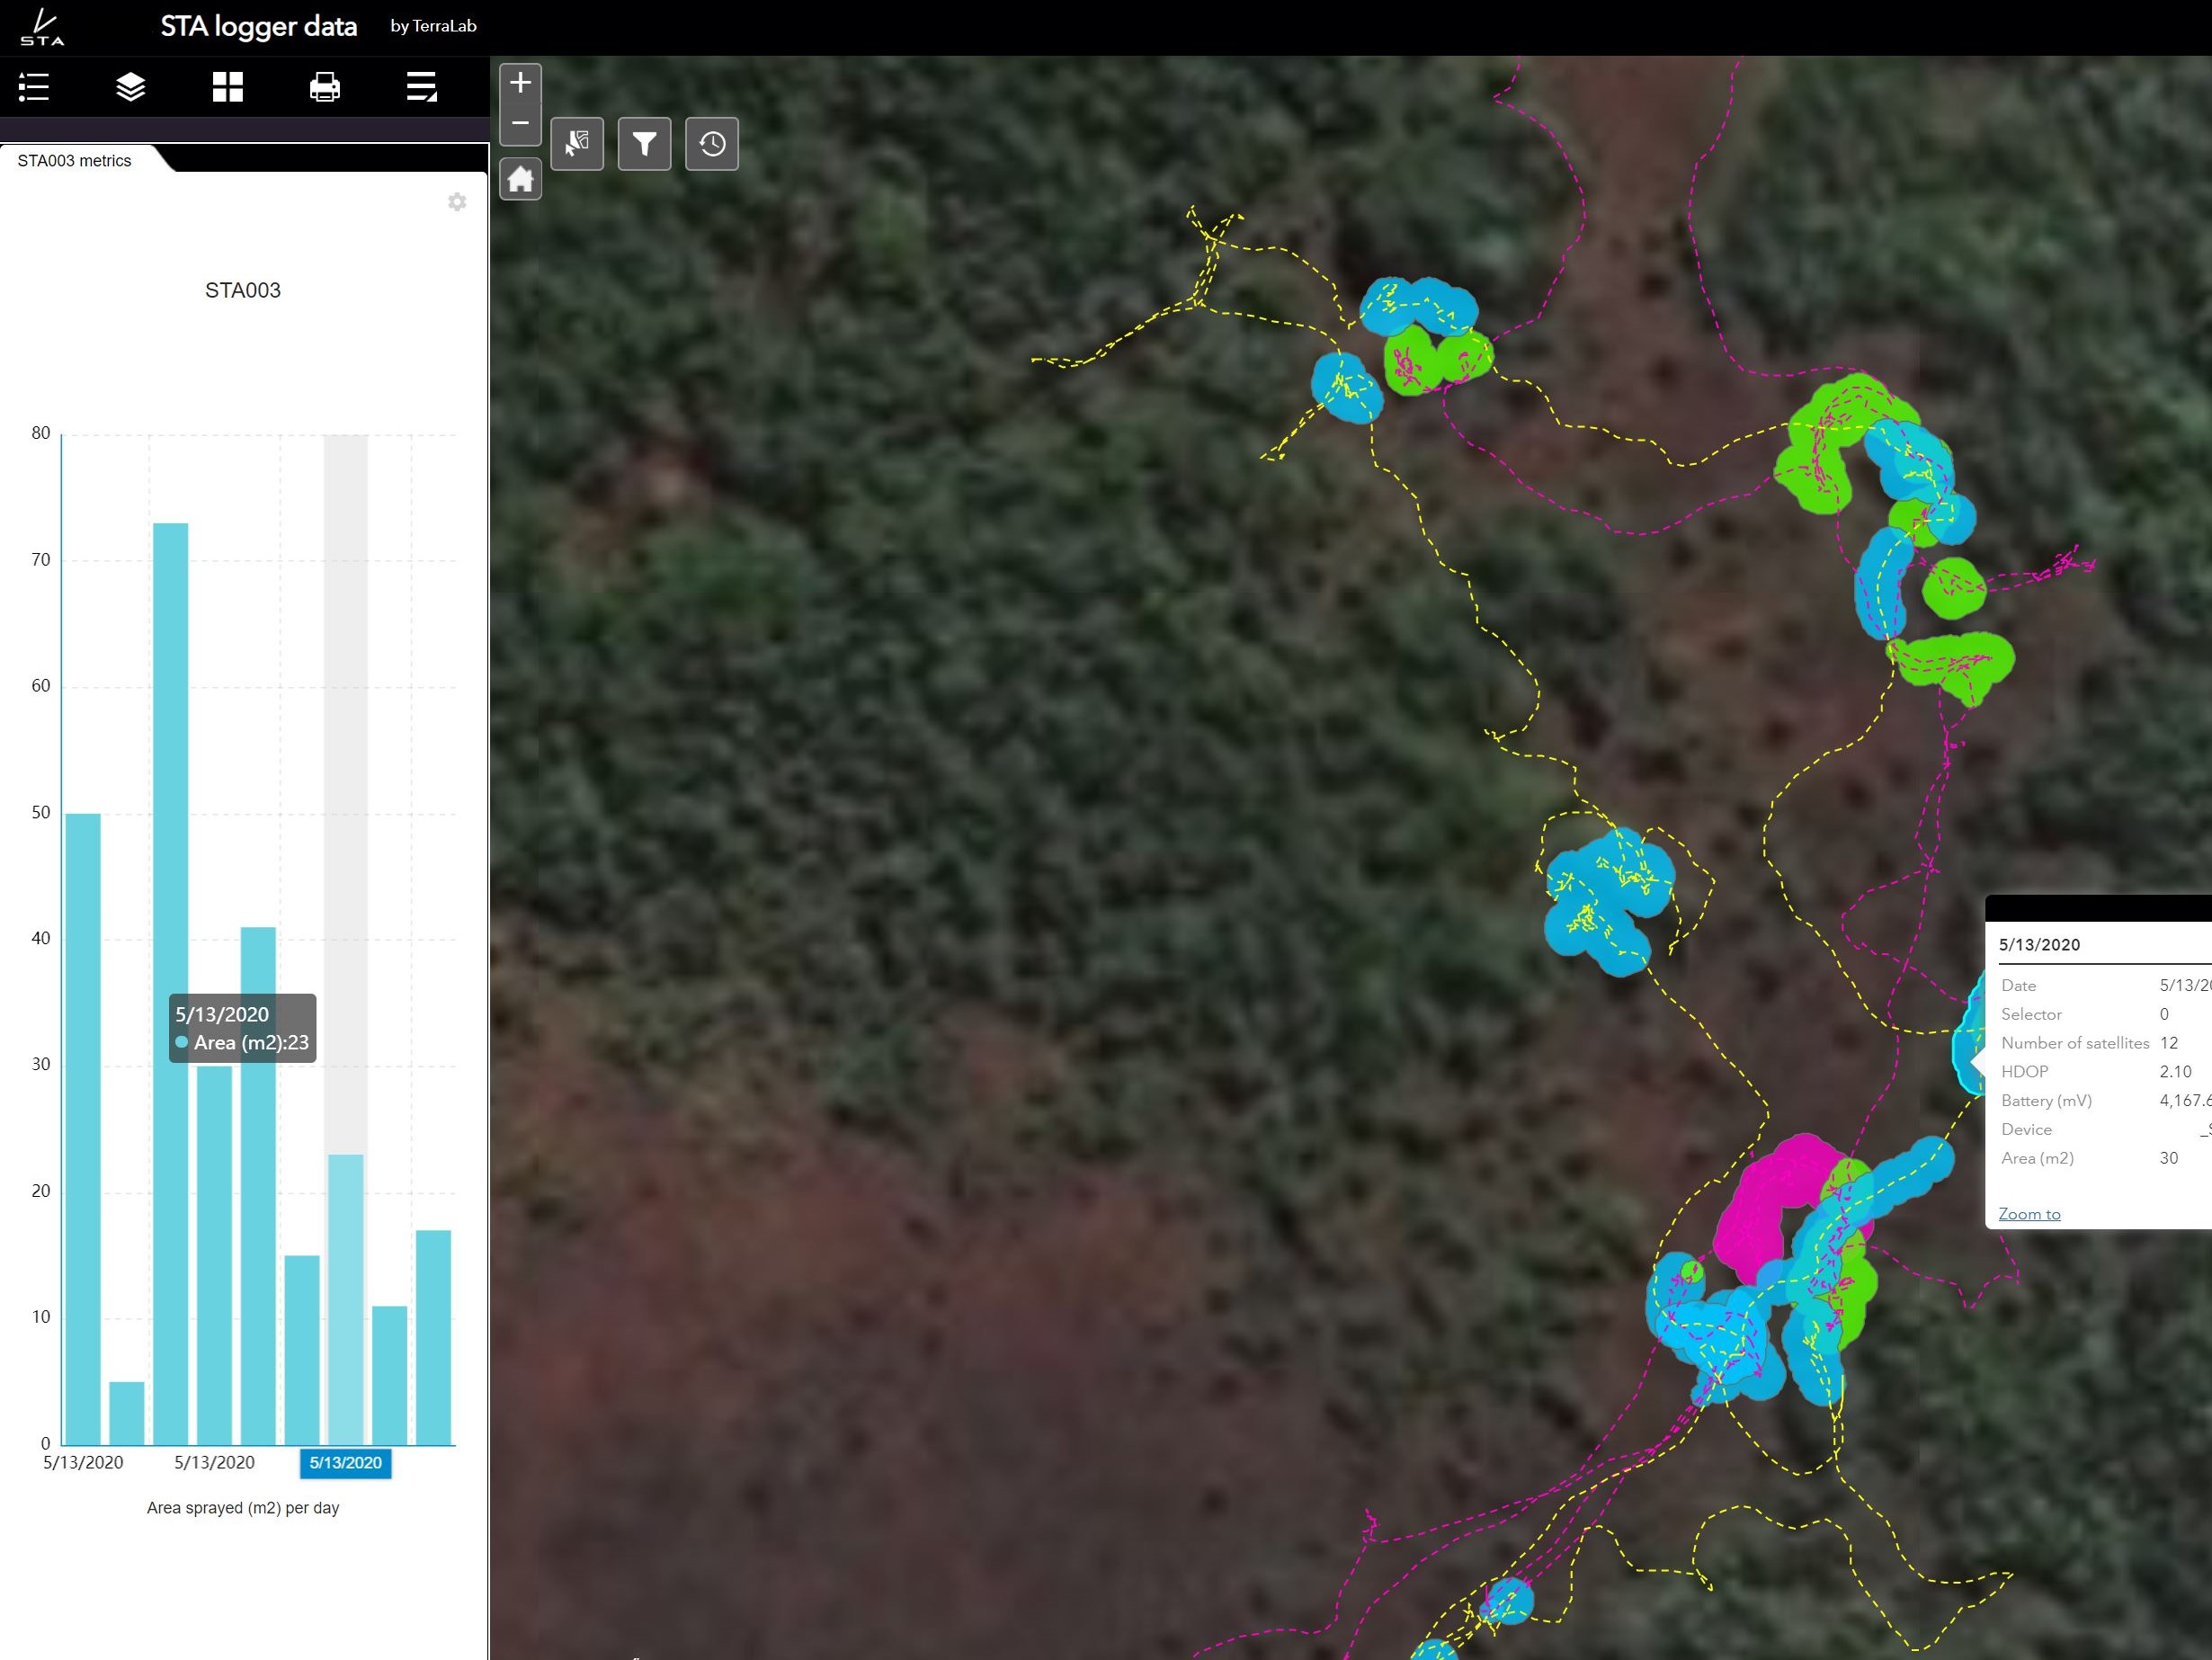
When you buy a STA logger, you also get an assortment of apps and services to use to interact and handle your weed management data. As well as the ability to use mobile applications to review and navigate to weed spraying locations, you will also gain access to a browser-based web app.
The browser-based web app includes additional analytical and map publication tools to help you get the most out of your STA logger data. It is relatively simple to use, but those unfamiliar with web maps might need a bit of an introduction. So I have made a short walk-through video that will touch on the features and how to use them:
If you don’t yet have a STA logger, but you want to follow along, you can always use our demo web app. Just note that there are some features that are disabled with the demo.
Also remember, if you are a GIS user it is also possible to add STA logger data directly into your GIS project without having to download it. This is easiest for ArcGIS users. This gives you the ability to display STA logger data alongside your organisations authoritative data to produce weed management maps and reports.
And one final pro-tip: While the web app was designed to be used in a desktop browser, if you open the link in a mobile browser the app will scale to your mobile device. This means you will enjoy the same analytics and map publication tools from your tablet or mobile phone. Imagine publishing a .pdf of your teams weed control data on your iPad in front of your client …
Recent Posts

STA logger onboarding
Read More »
So, why the STA logger?
Read More »
Adding STA logger data to QGIS without the need for downloading
Read More »
Project and herbicide reporting using the STA logger
Read More »
