STA logger location accuracy
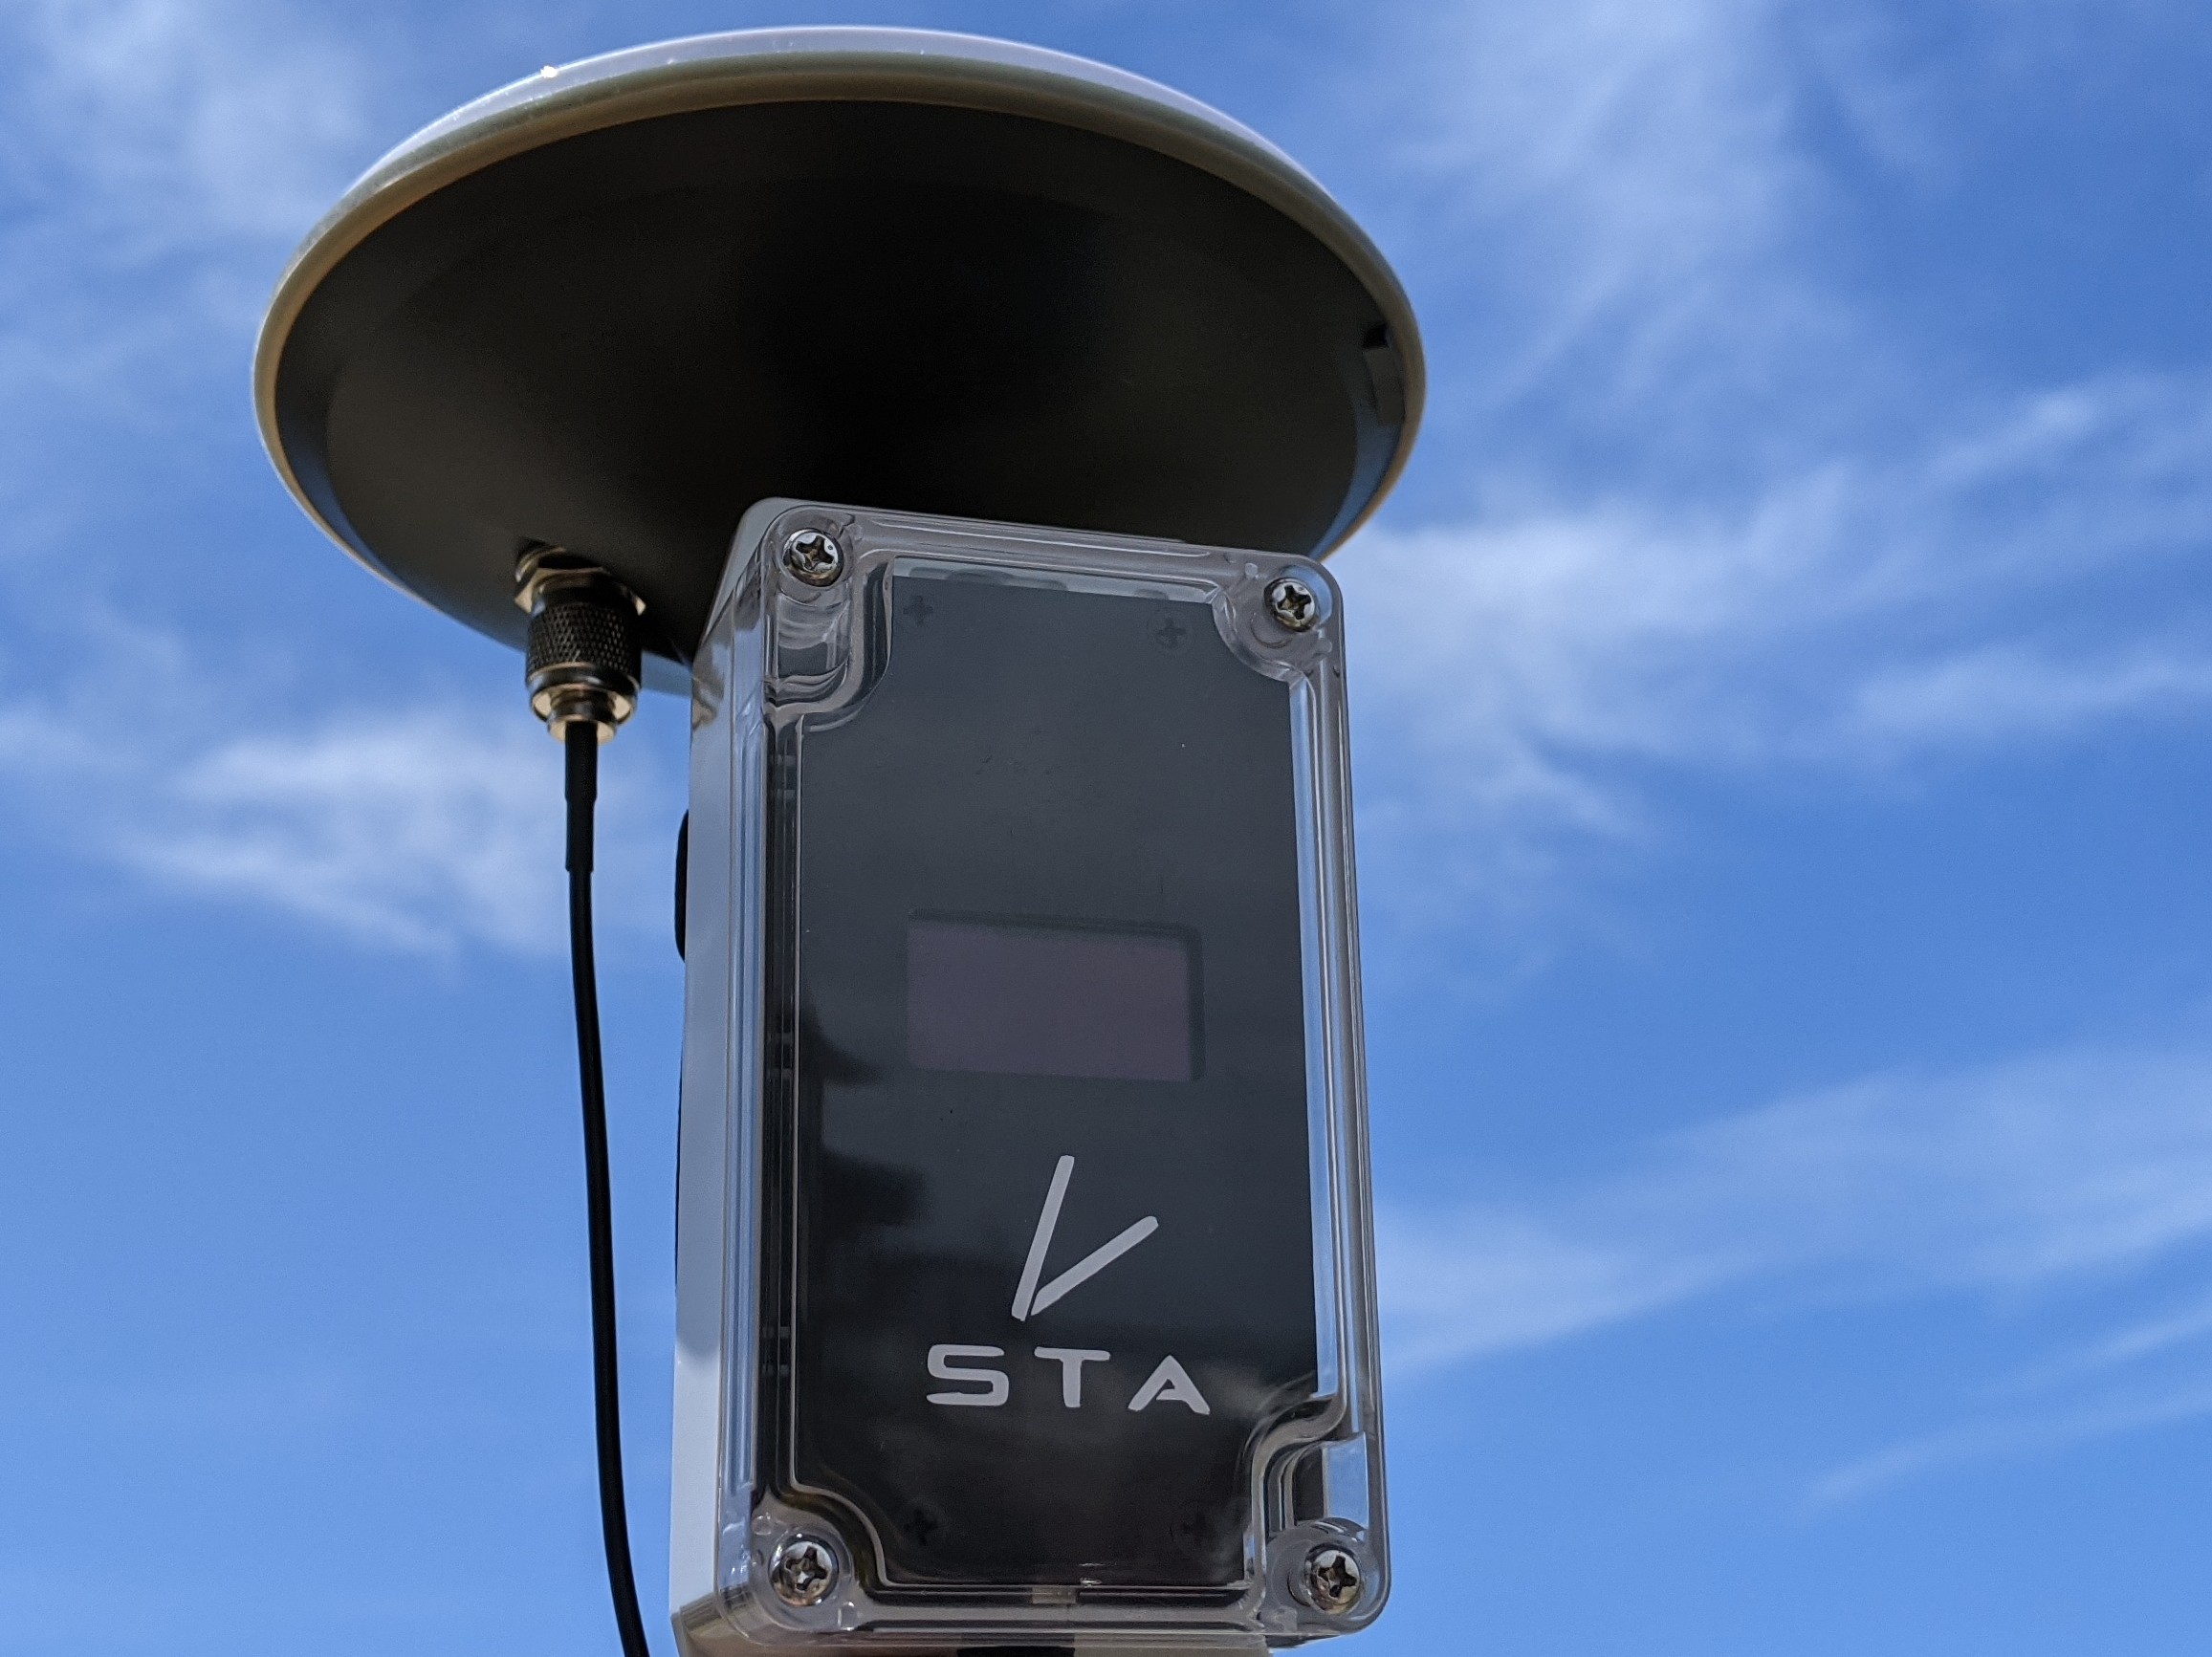
The STA logger contains a GPS component which provides the data with its location. It is a common question we get; “How accurate is the STA logger’s location?”. The response is usually a regurgitation of the technical specifications of the GPS module which states an average autonomous horizontal accuracy of <2.5 metres. However, we recognise and fully admit that this response can be somewhat unsatisfying for those looking for real world answers for the weed mapping scenarios. So we’ve set out to remedy this by performing some field tests and can confidently report that the STA logger performs much better than the reported 2.5 metres.
What follows is a brief test of the STA loggers location accuracy when compared to other location devices. There are a range of factors that influence a receivers accuracy so the tests conducted here are only as good as the conditions that they are performed under. Over time we hope to perform more tests to demonstrate the STA loggers accuracy in different scenarios.
The technical specifications
First off, what does the documentation say?
For those that aren’t familiar with satellite systems, GPS stands for Global Position System and is the US name for their satellite constellation. Technically, a “GPS” is a “GNSS”, or Global Navigation Satellite System. The term GPS just stuck from the US’ version and is colloquially used by most people today. The STA logger receives signal from a range of GNSS constellations including GPS (USA), Glonass (Rus), GALILEO (EU), QZSS (Jap) and SBAS (where available) meaning it has more options to acquire signal than just a GPS. Nevertheless, we will use the generic term “GPS” to mean “GNSS” even though the STA logger receives more than just the GPS signal.
The unit records at 1 Hz by default (1 point per second). From a cold start, the unit takes on average 26 seconds to get an adequate signal, however, once started in the morning, it will reacquire a lock from a hot start within 1 second.
All of this is secondary information. What really matters is the horizontal accuracy which, as stated above, is on average <2.5 m.
Lets put it to the test!
Location Accuracy Testing
Without getting into the weeds about it, lets just say that most location measurements come with a degree of uncertainty and take a lot of work to get the uncertainty value as small as possible. This is what the field of surveying is all about. There are survey locations plotted around the landscape, but they are best for stationary tests where you watch the location from a receiver wobble around the ‘known’ location. We may update this blog with a stationary test in the future, but what we are really interested in is a test of the location accuracy while the device is moving through the landscape, just like how a weed spraying operator might be moving.
For this test we will compare the STA logger to a conventional mobile phone receiver and an RTK (real-time kinematic) receiver. The RTK device will be considered our “truth”, though in reality it has a horizontal accuracy in the range of 3-5 cm (possibly higher for our test, but lets just consider it as ‘very accurate’). The mobile phone is considered equivalent to what many others may be using in the field. Despite what you might think, modern mobile phone GPS’ are very good and are usually able to get ~3 m horizontal accuracy in good conditions. So roughly equivalent to the STA logger and what you would expect from consumer grade GPS devices.
Test conditions:
- Date: 13/01/2021
- Location: Victoria, Australia
- Cloud coverage: 10-20% high cloud cover
- Obstructions: Parkland with very little tree cover
- Method: All equipment was given 10 minutes to gain a satellite fix. All units were walked along a footpath. The pattern was: walk down the centre of a path, return half way, deviate down a side path, return, then return to starting point. Total distance is approximately 587 m over 7 minutes (~5 km/h).
RTK receiver:
- Mapping Application: SW Maps, version 2.7.2
- Corrections Application: Lefebure NTRIP Client (last update 11/03/2020)
- Corrections: AUSCORS NTRIP Broadcaster
- Data stream: WOTG00AUS0 (baseline approximately 20 km)
- Coordinate system: GDA2020 MGA Zone 55
Mobile Phone
- Device: Google Pixel 3
- Application: ArcGIS Collector, version 20.2.2
- Coordinate system: GCS WGS 1984

Results
The path was walked as described above with all 3 devices tracking the path through their respective software. Upon completion, data was consolidated onto one map, reprojected where required and visually compared to one another with the RTK result being considered the most accurate.
Average distances from the RTK line were measured laterally (perpendicular to the path) from 20 locations along the path at an equal interval. We understand that this isn’t a true measure of the horizontal accuracy as it isn’t measuring the distance from point to point. But it was useful enough for the purposes of this first publication. To differentiate it, we’ll call it “lateral accuracy”.
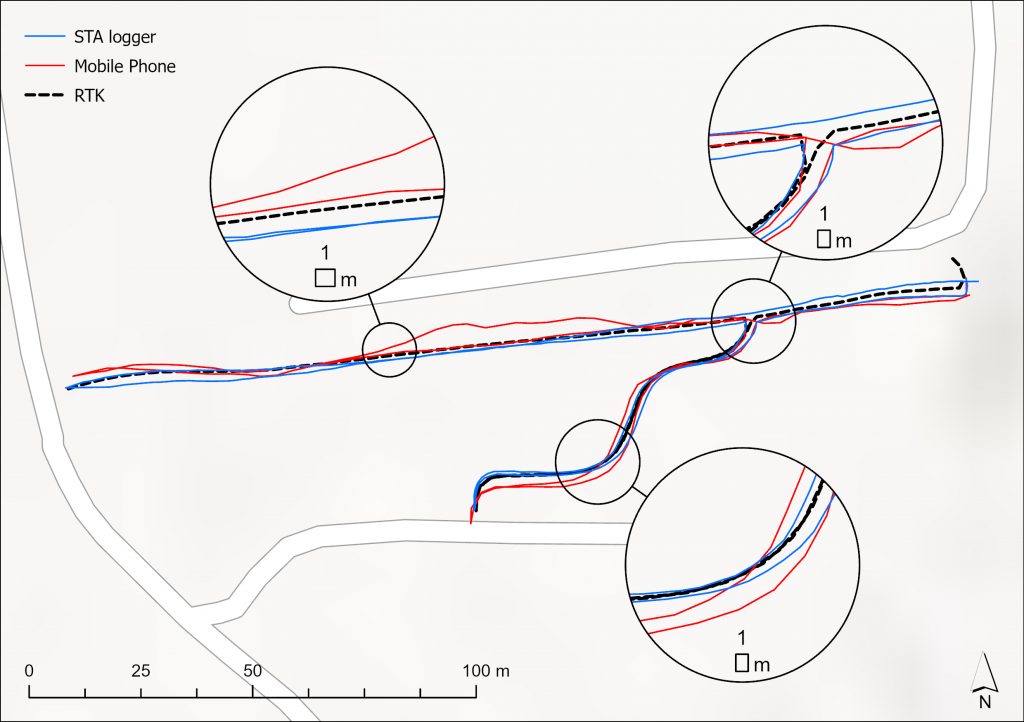
- The lateral accuracy of the STA logger was, on average 0.85 m and never exceeded 2.27 m from the RTK line.
- The lateral accuracy of the mobile phone was, on average 1.42 m and never exceeded 5.18 m from the RTK line.
Lets remember that the RTK line has it’s own level of variability but it was negligible (<0.1 m).
The STA logger out performed the mobile phone in both maximum distance and average distance from the RTK line. It is apparent from the plot above that the STA logger was more consistent than the mobile phone which tended to dart from side to side and occasionally veer away from the path. The STA logger, tended to follow the same pattern as the RTK line, even though it was offset from the line by about 80 cm on average. The obvious outcome is that RTK is very good, but this requires expensive hardware, specialist knowledge, set up time, and in our configuration, mobile phone network coverage. RTK just simply isn’t feasible in most situations which is why the STA logger was designed as it is – to be as accurate as possible while maintaining automation and simplicity.
This testing was conducted without the assistance of a Satellite Based Augmentation System (SBAS) which is available in many areas and is expected to improve accuracy even further.
HDOP and satellite acquisition
Before we wrap up, a little bit more on the boring stuff. A critical part of how well the STA logger performs is the rate at which it acquires its signal. It wouldn’t be very useful if it took half an hour before it was useable in the morning, would it? So below we have the stats on how many sats are in use, and the HDOP over time during the test. Note, that this unit had been used in this part of the world before, meaning it can acquire signals faster. If you recently recieve a unit from another part of the world, or it has sat on a shelf for a while, the first time you use it, it may take a little bit longer. I won’t get into the reasons why, but it is worth understanding those factors. If you use it routinely, and you don’t ship it all over the world, you could expect results similar to this.
Before reading on, understand that what you want is a high satellite count, and a low HDOP.
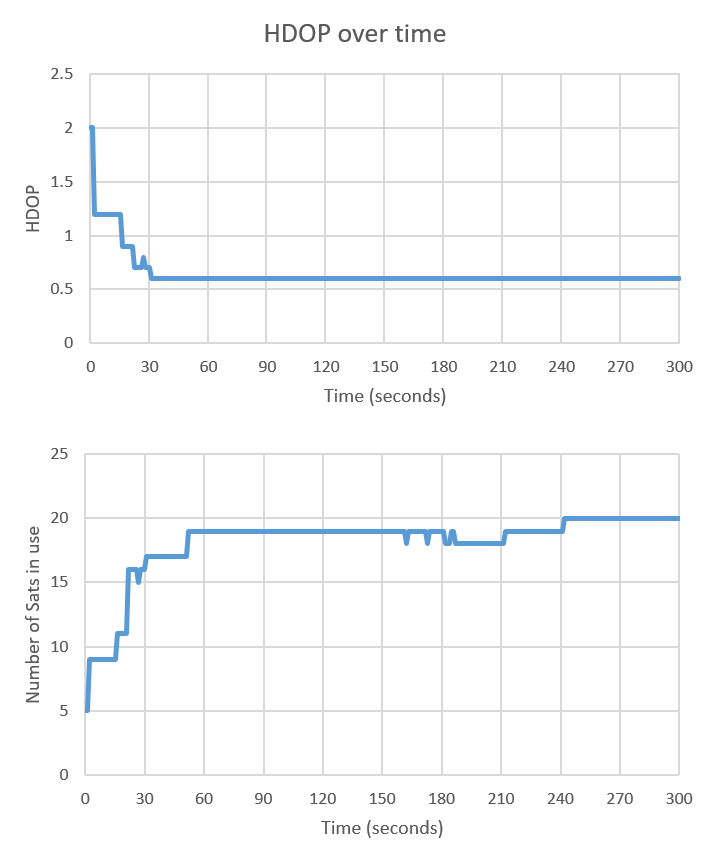
What we can see here, is the unit picked up 5 satellites immediately after being turned on which increased to 9 after 2 seconds. Over the same 2 second period, the HDOP went from 2.0 to 1.2. This means the first 2 seconds of data may be a bit poorer than the rest but even still, those results will be reasonable. Soon after that, we can see the satellite count stabilised at 9, then quickly ramped up to 16 after 20 seconds. This doesn’t mean the accuracy will necessarily be better, but the signal will be more resilient in a challenging environment such as near trees as it has redundancy. It is worth noting that this is the number of satellites used to calculate the location. The number of satellites tracked is higher, but it doesn’t use all the satellites in view, as some have a poor signal or may be too close to the horizon.
It took 31 seconds for the HDOP to reach 0.6 where it remained stable for the 5 minutes of the test. This would vary more in an environment with more occlusion of the sky as satellites came in and out of view.
Your STA logger data
So you want to look at the location stats yourself? Sure thing. All you have to do is turn on the point layer from your STA logger and select your points of interest. The stats will appear in the popup.

Alternatively, you can view the stats of a whole selection of points by using a combination of the select tool and/or attribute table.
- Option 1, attribute table only – Zoom in to your area of interest. Open the attribute table at the bottom. Select the tab for your relevant device and feature type (you want the points). Then click “Filter by map extent”. This will show you the stats of only the items in the map field of view.
- Option 2, select tool and attribute table – Open the select tool in the top left corner. Select the points you are interested in. Open the attribute table. Select the tab for the device and feature type (points) you made the selection on. Click on Options and then choose “Show selected records”.
Furthermore, you can export a selection you have made to json or csv where you can then plot the findings in a similar manner to what we have shown in the graphs above.
Summary
We hope to perform more tests with more rigorous methods and a greater variety of conditions in the future.
These results demonstrate that the STA logger is a first class, automated weed mapping solution with great location accuracy.
Recent Posts
STA logger onboarding
Read More »
So, why the STA logger?
Read More »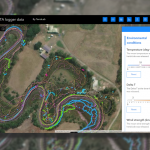
Project and herbicide reporting using the STA logger
Read More »
Why weed control contractors are flocking to use the STA logger
Read More »