Managing STA logger data in ArcGIS Pro
We’ve made improvements to further enhance your experience when working with your weed mapping GPS data. This will change how you use it in ArcGIS Pro.
Consolidated device layers
In October 2022 we made some updates that change how we handle the STA logger layers. Originally, you would get three layers, points, tracklog and spray zone, for each device. So if you had 4 devices you would have 12 layers. As part of this update, you now get one consolidated layer for each geometry type. That is, you get three layers, points, tracklog and spray zone that contains all of the data for all of your loggers. This makes it easier to manage your data when you get many devices or to integrate the data into your organisation.
ArcGIS Online
So what does this mean for the standard STA logger user who interactis with ArcGIS Online and the STA logger web application? Well, nothing. Although the change described above alters how the data is stored, we have painstakingly broken it up in your web map so that you still get one layer per device. See below …

ArcMap, ArcGIS Pro or other desktop app
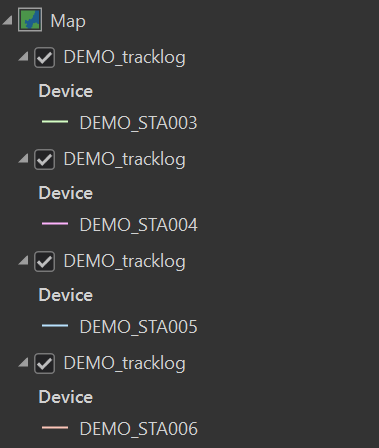
For desktop users, it does change things a little. When you add data to your project, it will appear like this:
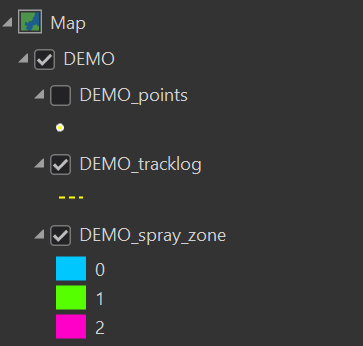
So, all of your data is in these three layers. But you might want to see each individual device.
If you have a background in GIS, you might know how to do this, but if not, read on. We’ll explain some ways of doing it in ArcGIS Pro.
Symbolise by device
In this example, we will display each device as a different colour. But ultimately they are still in the same layer.
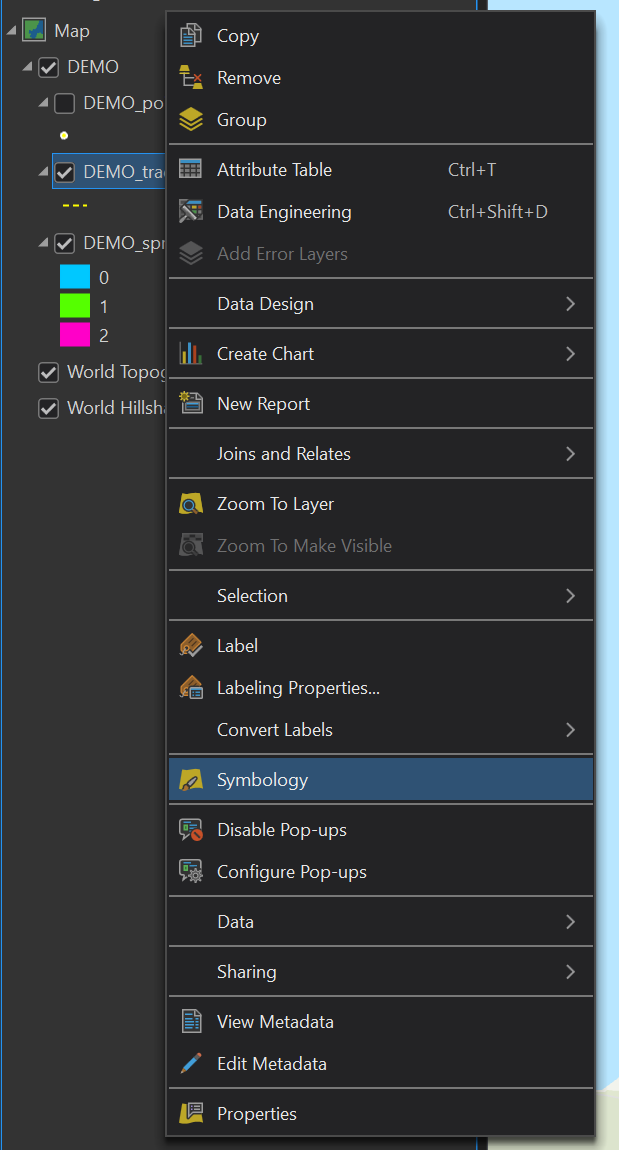
Highlight the layer in the table of contents, right click and select ‘Symbology’.
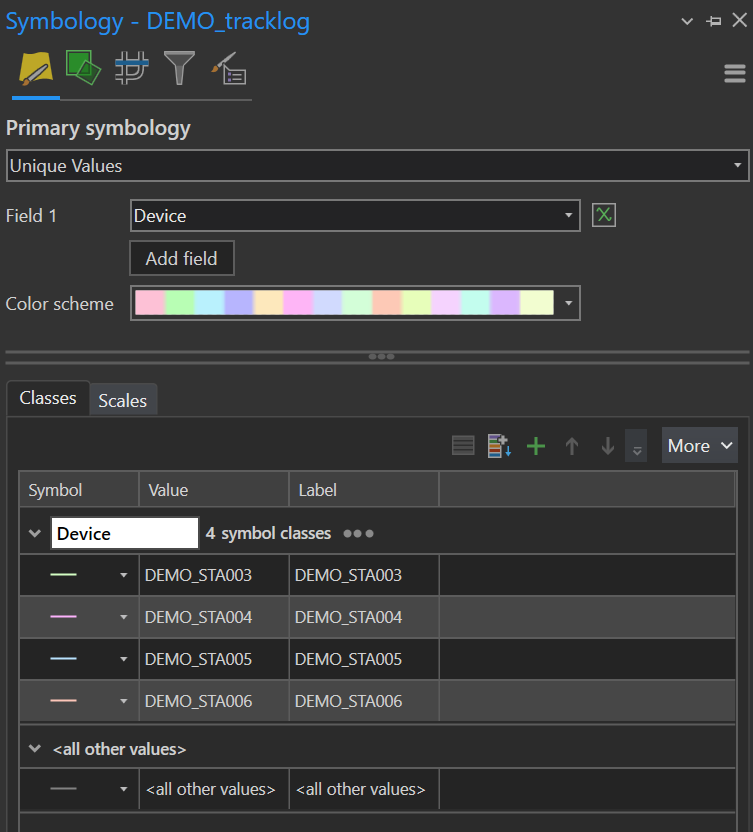
This will open the symbology pane. There, under ‘Primary Symbology’, you can change from ‘Single Symbol’, to ‘Unique Values’. Then change the field to ‘Device’.
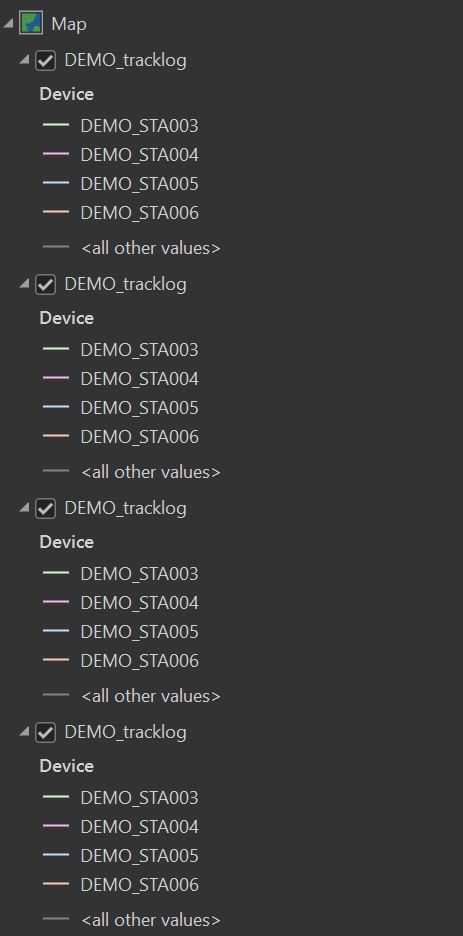
Now all of your devices will show up as different colours. You can dig into the symbology more to change their individual appearance.
Create separate layers and symbolise
From there, you can break these up into separate layers. To do that, right click on the layer, select ‘copy’, then go to the the top of the contents and select the map icon. Right click and select ‘paste’. Repeat this for how many layers you want. Alternatively, you can select the layer, hold control on the keyboard and then drag the layer to a new location in the contents and it will duplicate it.
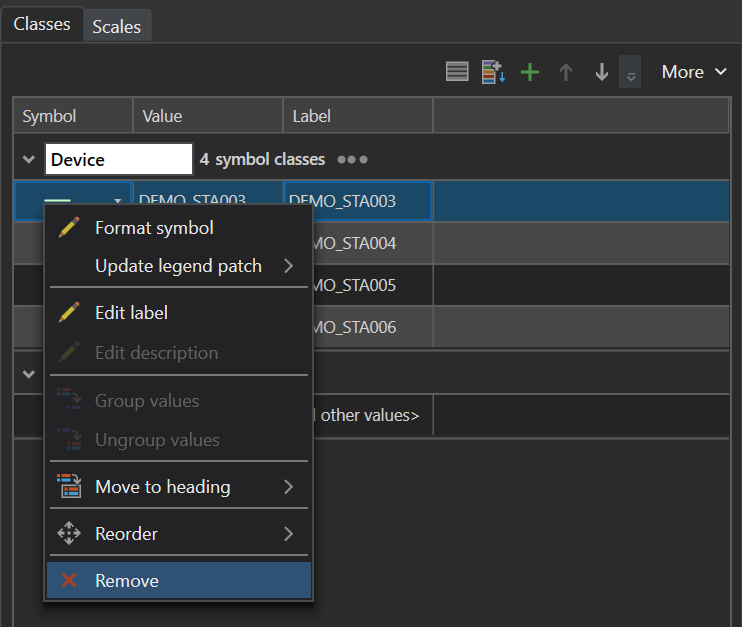
Then go into the symbology of each layer, and with Unique Values still set as the primary symbology, delete out the symbols (devices) you don’t want. So for the layer that you want to be unit 6, simply remove units 3, 4 and 5 from the symbology. Also get rid of ‘<all other values>’.
In this example, the data is still technically there for each duplicated layer, it’s just the devices that aren’t symbolised are invisible.
Using definition queries
As mentioned above, the symbology option just makes the data invisible, but it is still there. Definition queries completely hide the data you don’t want to show (including from the attribute table). Think of definition queries as filters.
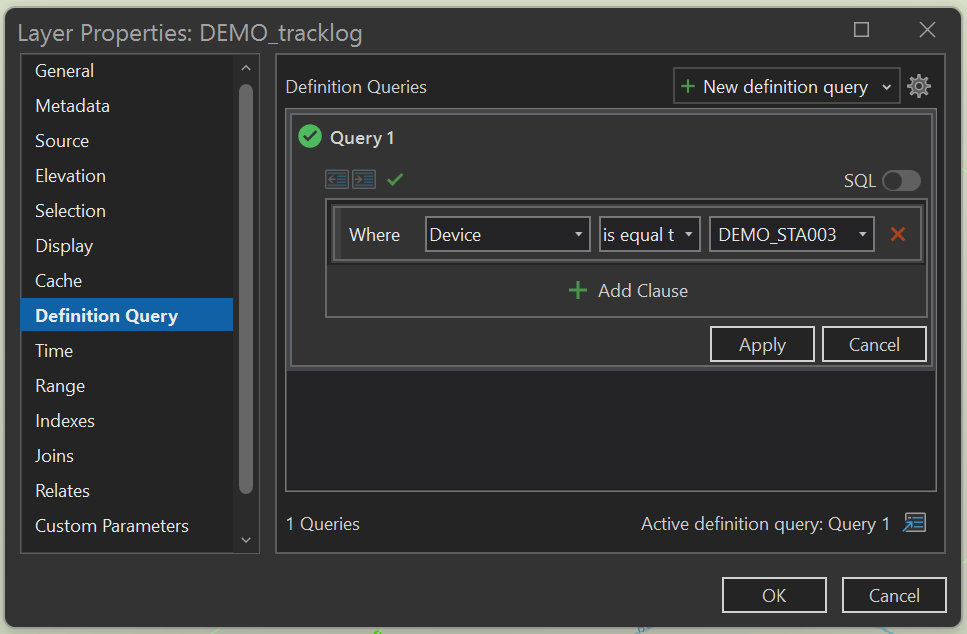
Go back to the original layer (with all devices in it). Right click on it in the contents and go to ‘Properties’. In the properties, go to the ‘Definition query’ tab and select ‘New definition query’.
In the first drop down box, select the ‘Device’ field, leave the second drop down box as ‘is equal to’ and in the final one, select the device you want to see. Click Apply, then Ok.
Now that layer with the definition query applied will only show the data for that particular device. You can duplicate the layer, and then change the definition query to create layers for each device.
Also, consider symbolising your data with a heat map!
This update will make it easier to manage your weed mapping GPS data.
Recent Posts

STA onboarding
Read More »
So, why the STA logger?
Read More »
Post processing STA Explorer HA data
Read More »
Accurate tree planting mapping – Using the STA explorer HA
Read More »